Cross Correlation of Corporate Profits and Market Movements
Understanding the intricate interplay between corporate fundamentals and market performance represents a central challenge in financial analysis. This article investigates the cross-correlations and lag dynamics between upsampled quarterly corporate profits and daily S&P 500 returns from FRED.
Our results provide confirmatory insights into the difficulty of showing these relationships, highlighting inherent methodological limitations.
Methodological Framework: Upsampling Quarterly Data to Daily Frequency
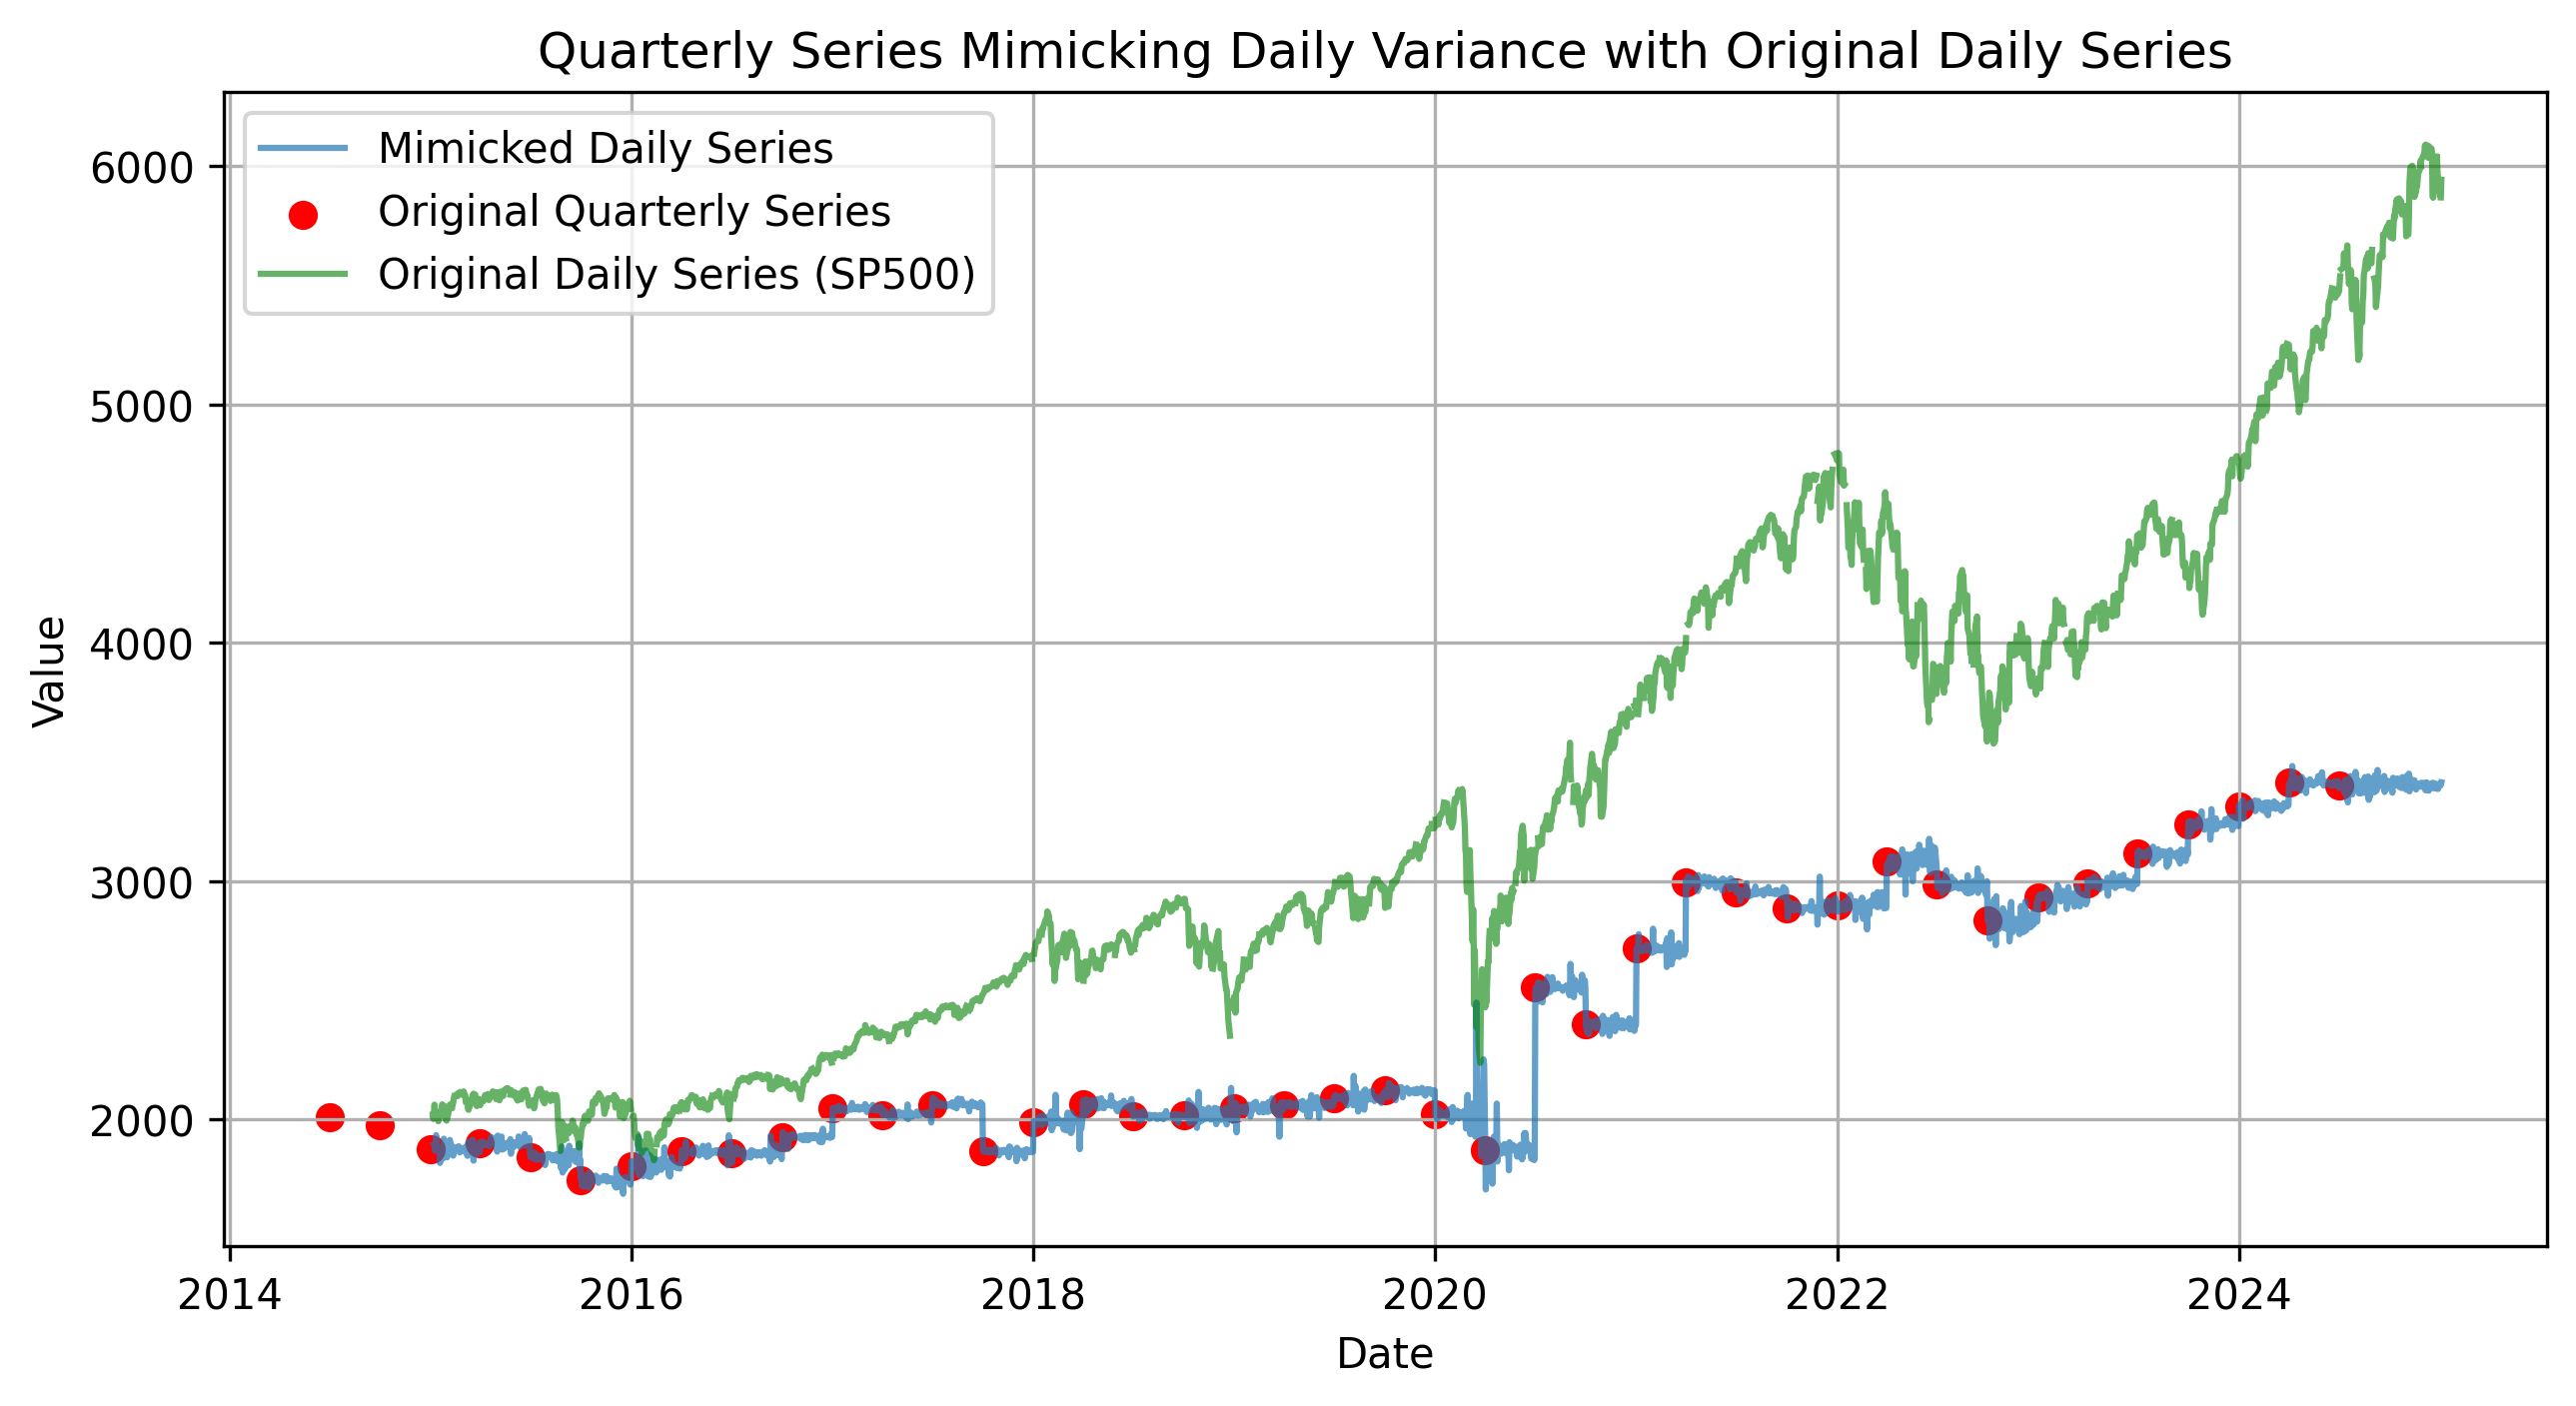
Corporate profit data, reported quarterly, does not inherently align with the high-frequency dynamics of daily stock market returns. To address this discrepancy, quarterly corporate profits were upsampled to a daily frequency using a forward-fill approach. Importantly, this method alone fails to capture the volatility intrinsic to daily financial data.
To resolve this, dynamically scaled noise was introduced, calibrated using the rolling variance of S&P 500 returns. This approach produced a "mimicked daily series" that preserves the long-term trends of corporate profits while embedding short-term variability analogous to daily market data.

Analyzing Temporal Linkages Through Cross-Correlation
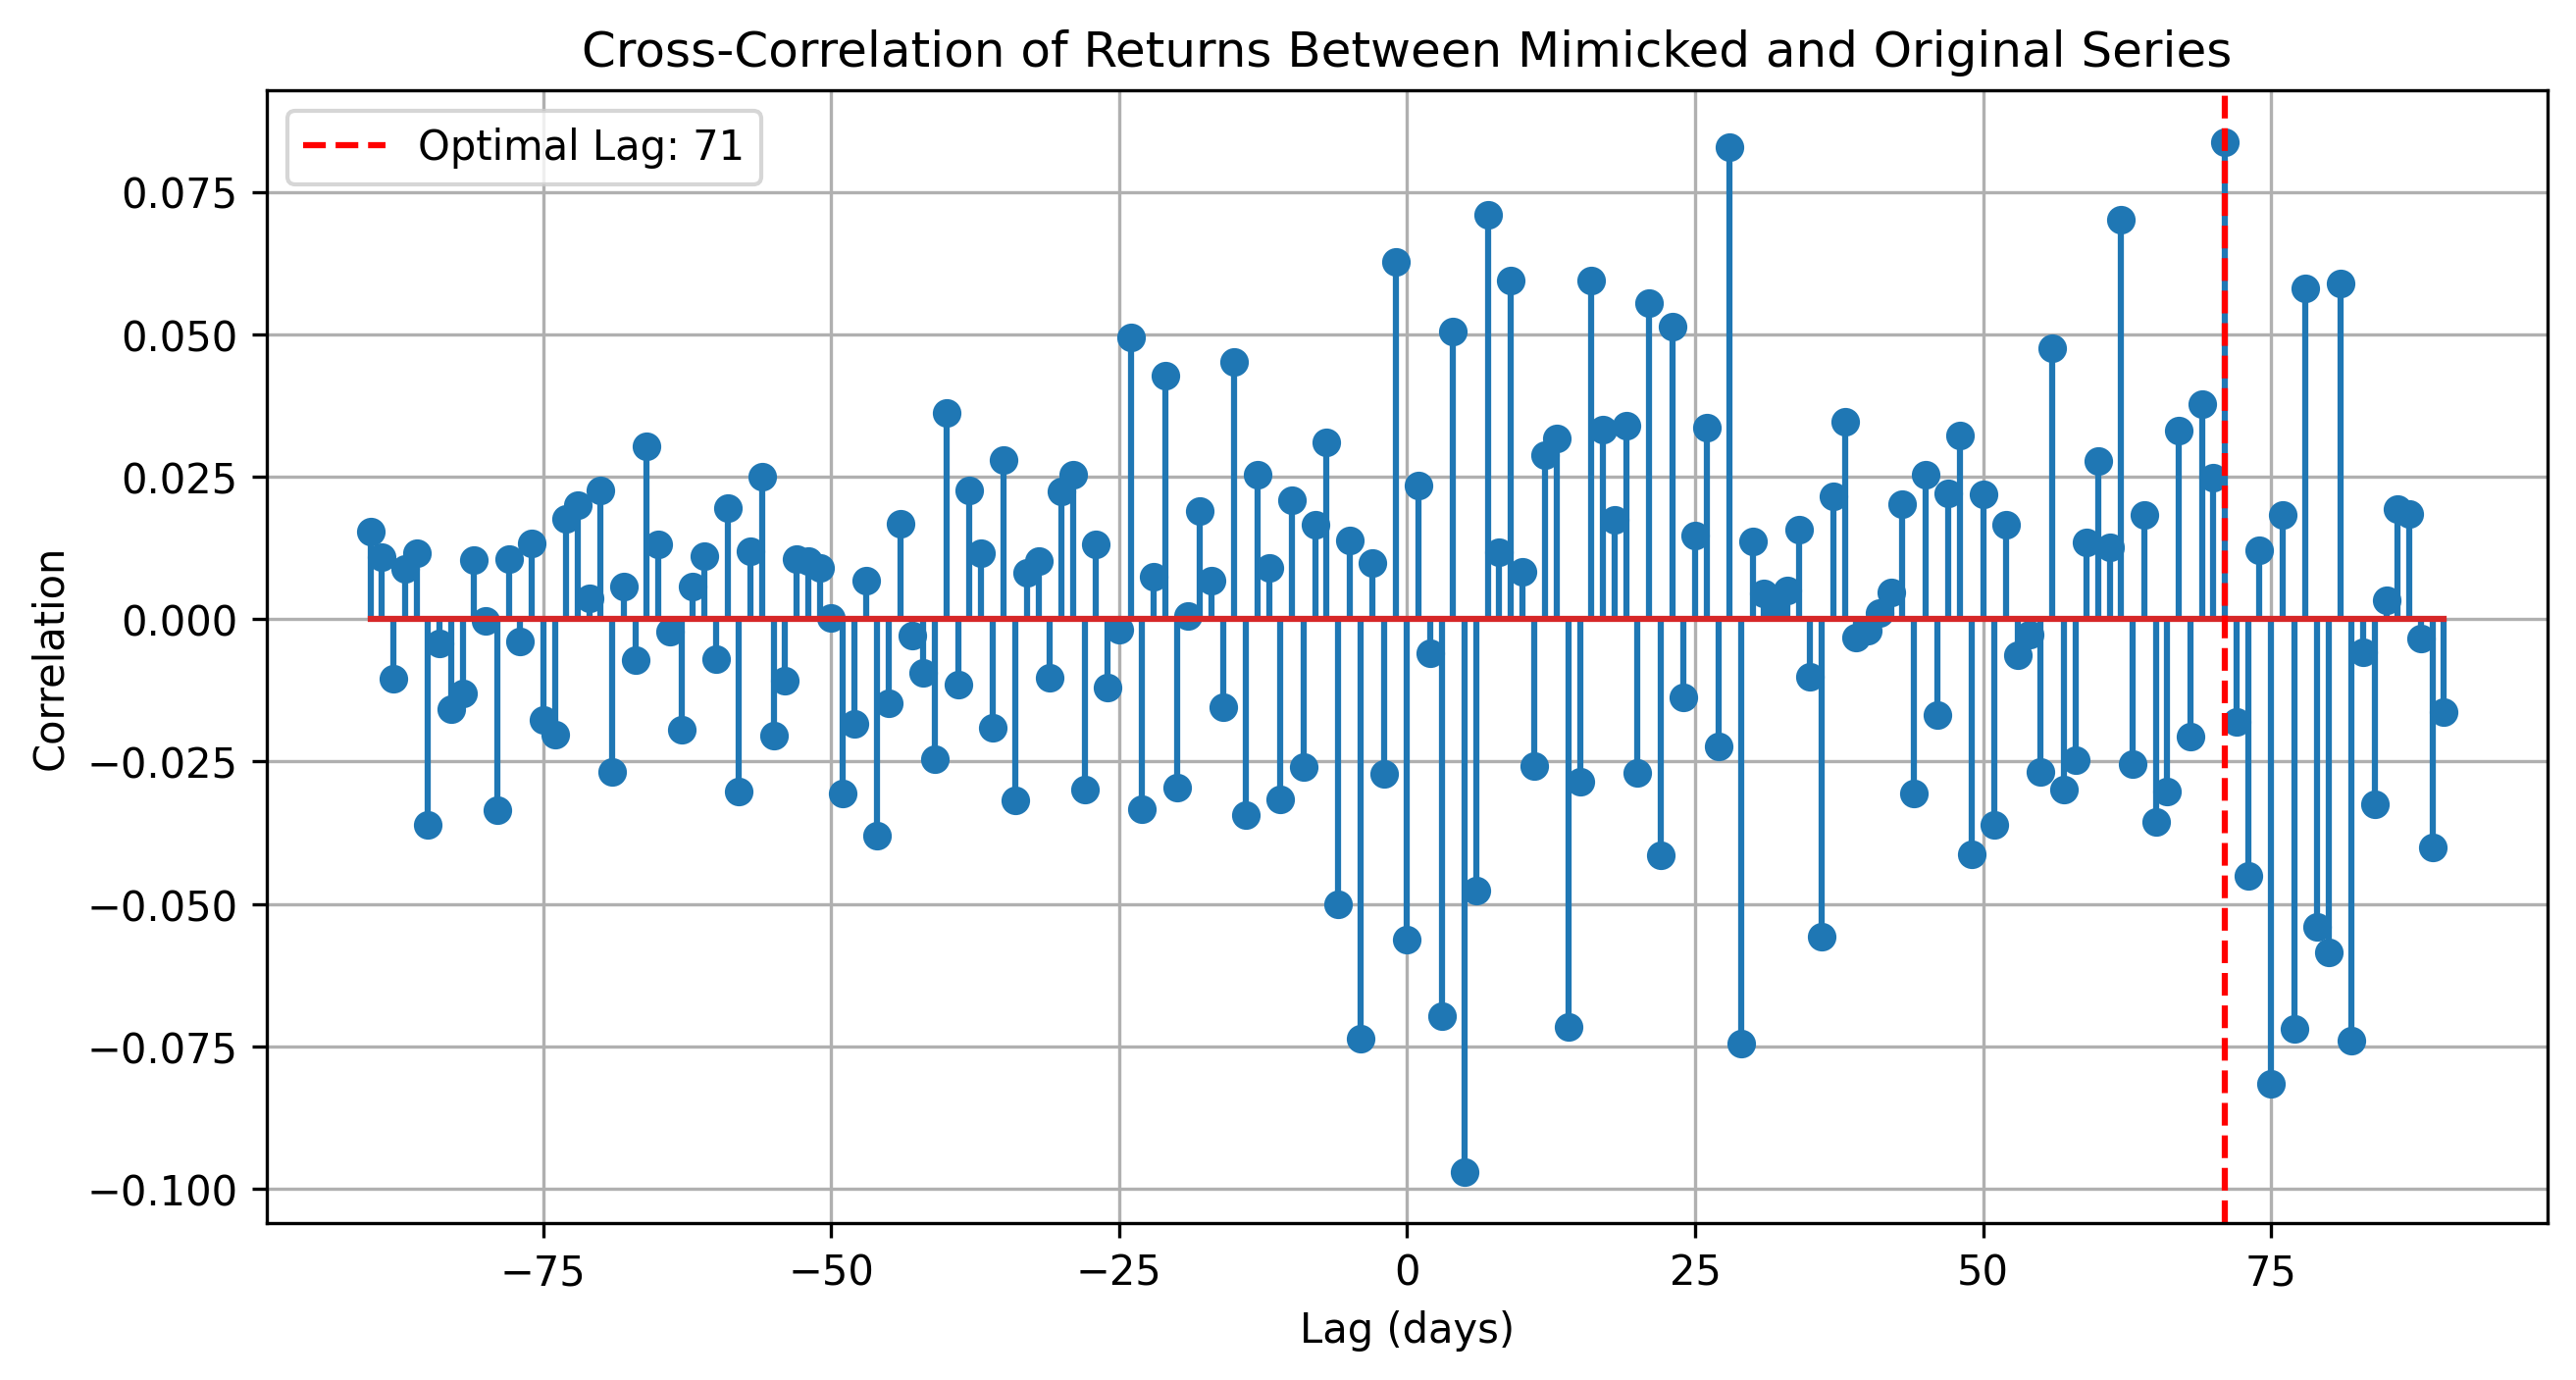
The analysis sought to determine whether shifts in corporate profits, as represented by the mimicked series, exhibit lead-lag relationships with daily S&P 500 returns. Cross-correlation analysis over a lag range of ±90 days was employed to identify the optimal lag—the point at which correlation peaks.
Key findings include:
- Weak correlations were observed across all lags, with a pre-lag correlation of -0.0562 and a marginally improved post-lag correlation of 0.0036.
- The optimal lag provided no significant evidence that corporate profits systematically lead or lag stock returns on a daily basis.

Our findings resonate with prior research, such as Gilchrist and Zakrajšek (2012), which emphasized the challenges of connecting macroeconomic indicators to real-time market fluctuations. Their work demonstrated that financial variables often capture signals orthogonal to the immediate economic state.
Visualization of Lagged Relationships
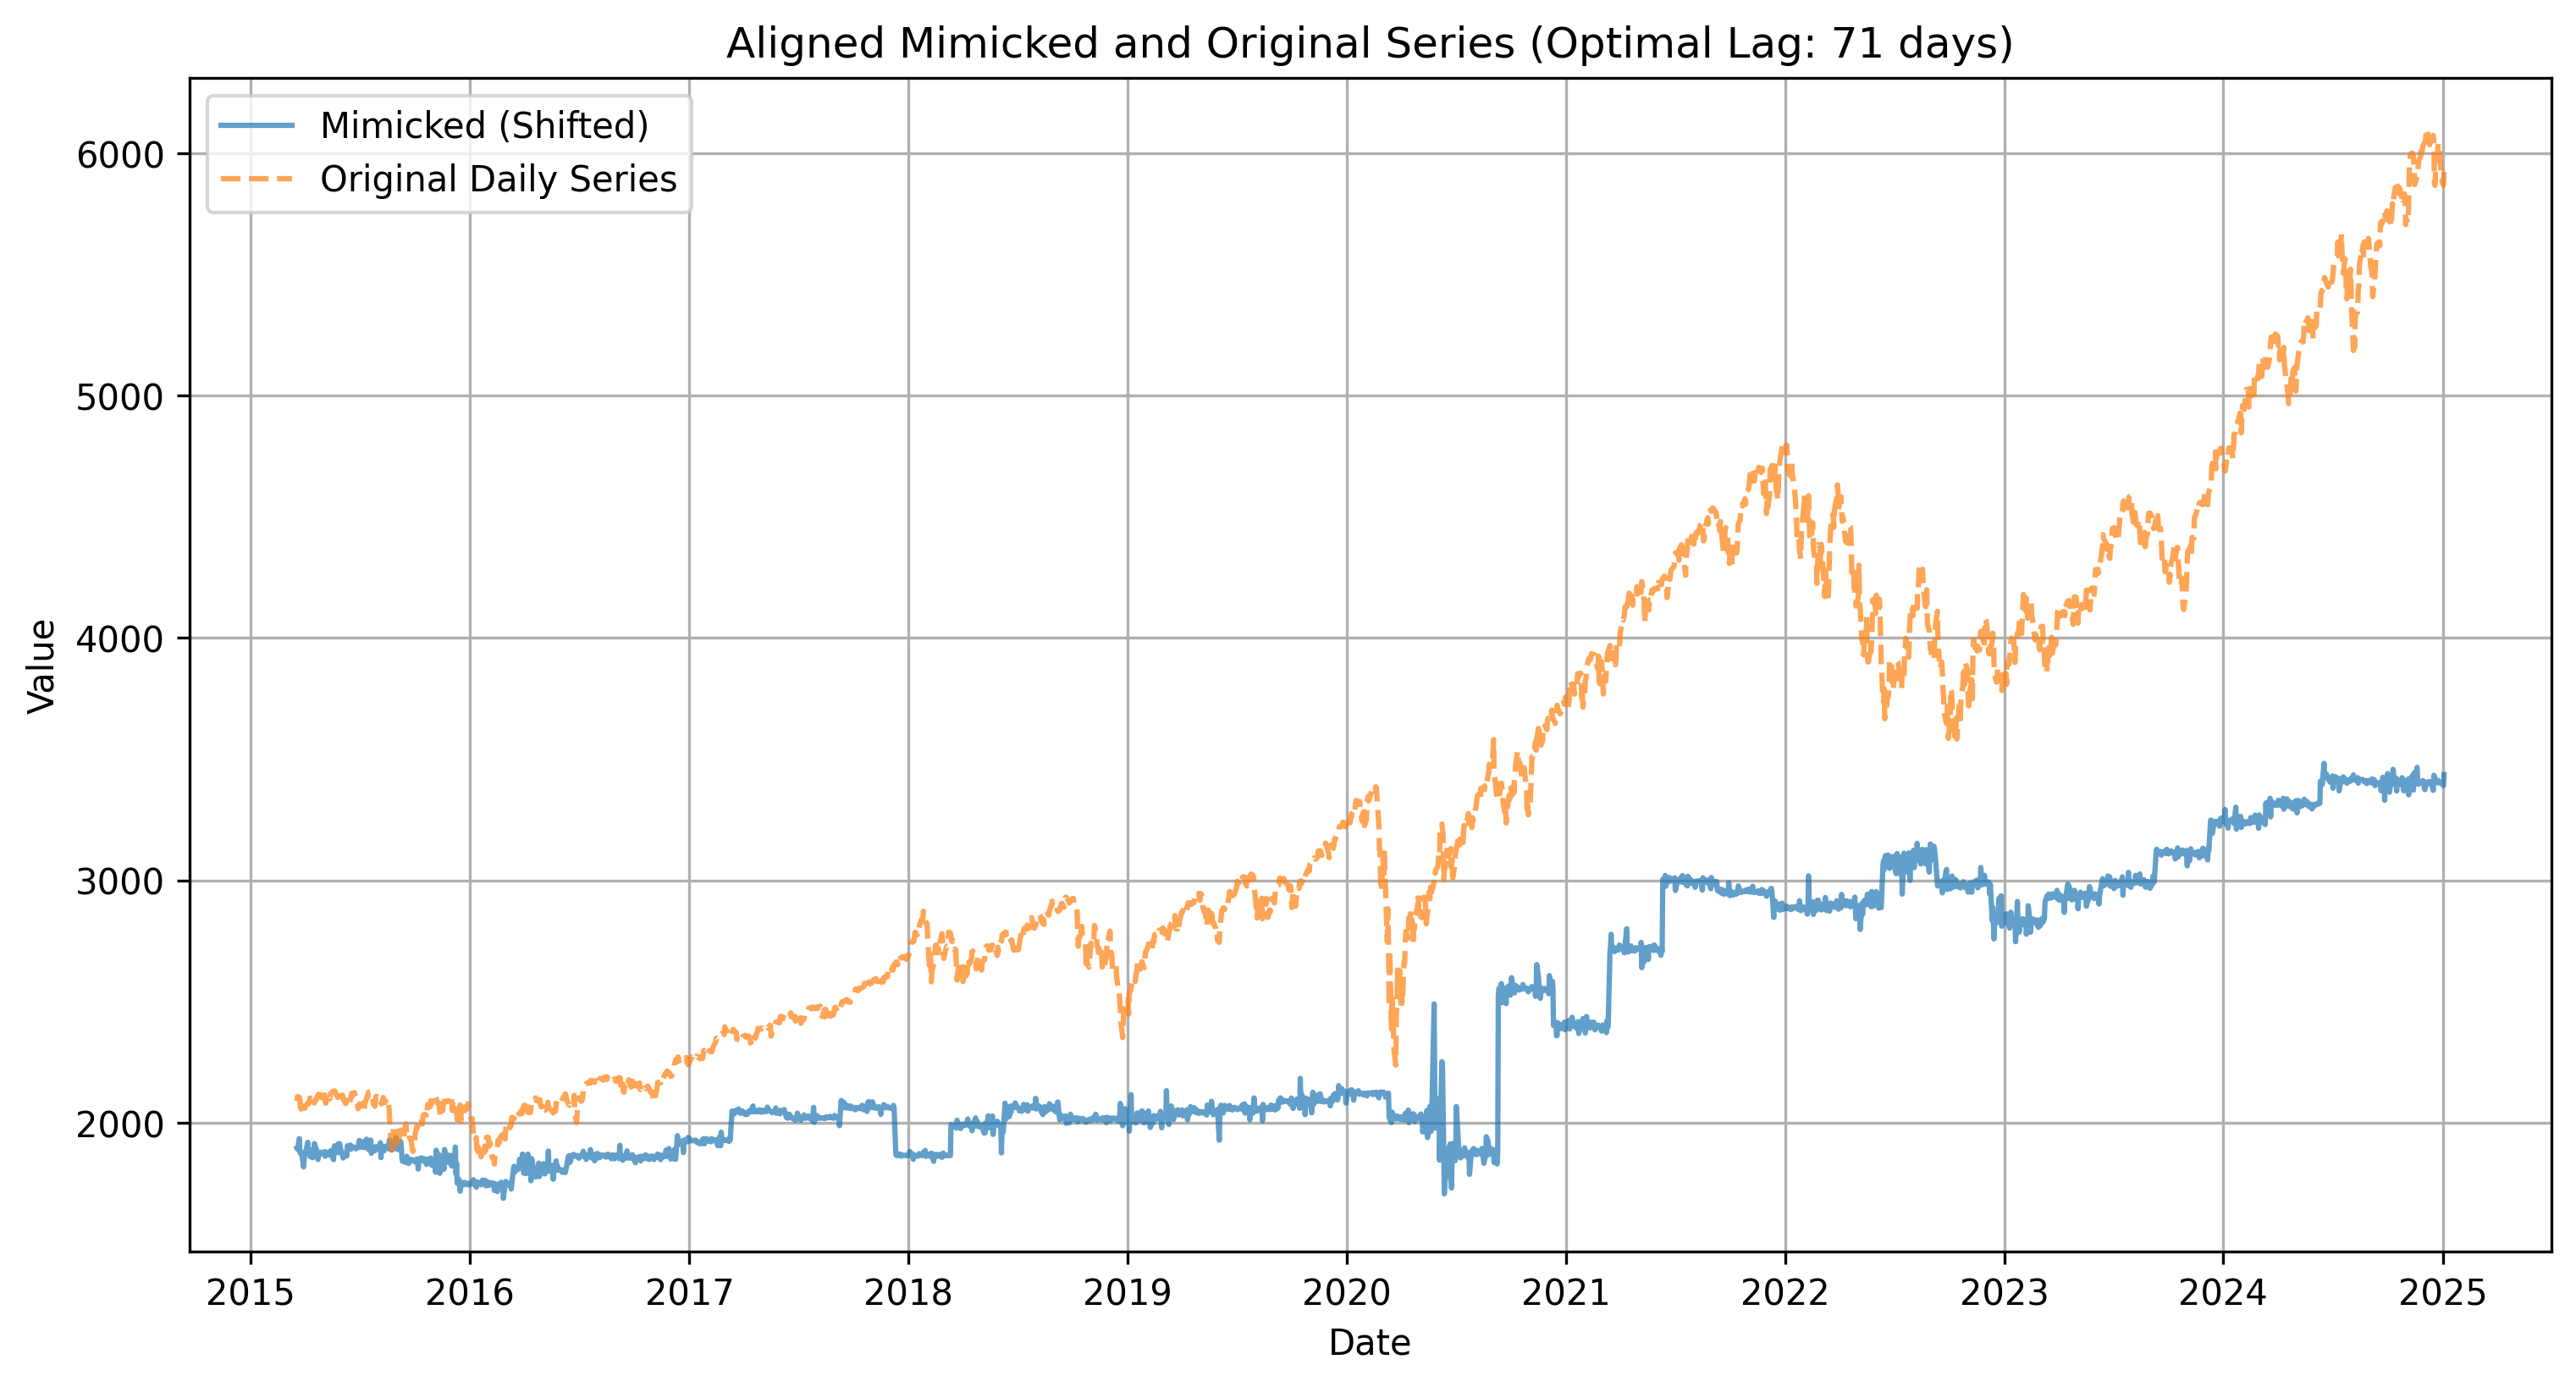
To further explore the weak observed correlations, the mimicked series was shifted by the optimal lag and compared to S&P 500 returns. This overlay revealed temporal alignment but failed to substantiate meaningful correlations. The results underscore the inherent difficulty of translating low-frequency economic data into actionable high-frequency insights.

As we can see, there's not much visual difference in the lagged overlays.
Quantitative Assessment: Regression Analysis
A linear regression analysis quantified the relationship between lagged corporate profits and daily S&P 500 returns:
- Regression coefficient: 0.0025, indicating a negligible effect size.
- R² score: 0.0000, reflecting the limited explanatory power of the lagged profits series.
These results align with studies like De Santis (2016), which explored credit spreads and economic activity in the Eurozone, highlighting the dominance of unobservable systematic components over observable fundamentals. Similarly, Moody’s Analytics (2020) documented the gradual and limited impact of macroeconomic shocks on financial markets.
Implications for Financial Modeling
This analysis reinforces the notion that the relationship between corporate fundamentals and market performance is complex and multifaceted. While quarterly corporate profits reflect long-term economic health, their ability to predict daily market movements is constrained.
Building on Gilchrist and Zakrajšek (2012), who emphasized the role of deviations from expected trends—such as the "excess bond premium"—the weak correlations observed here suggest that daily market dynamics are influenced more significantly by investor sentiment, liquidity fluctuations, and external shocks than by corporate profit trends.
Conclusion: Bridging Temporal and Frequency Disparities
The effort to reconcile quarterly corporate profits with daily S&P 500 returns highlights the inherent challenges of frequency mismatches in financial analysis. While tools like upsampling and dynamic noise scaling provide plausible approximations, they typically do not bridge the divide between macroeconomic and market-level data.
This short study serves as a reminder of the complexity of financial systems and the necessity for nuanced and conservative approaches when interpreting cross-frequency relationships. For practitioners, it underscores the importance of integrating caution when using macroeconomic insights with market-specific dynamics.
References
- Gilchrist, S., & Zakrajšek, E. (2012). Credit Spreads and Business Cycle Fluctuations. American Economic Review, 102(4), 1692–1720.
- De Santis, R. A. (2016). Credit Spreads, Economic Activity, and Fragmentation. European Central Bank Working Paper Series, No. 1930.
- Moody’s Analytics. (2020). Credit Risk and Bond Spreads: Dynamic Relationships and Trading Strategies. Viewpoint Series.